Possible Ovulation
Labels:
infertility,
PCOS
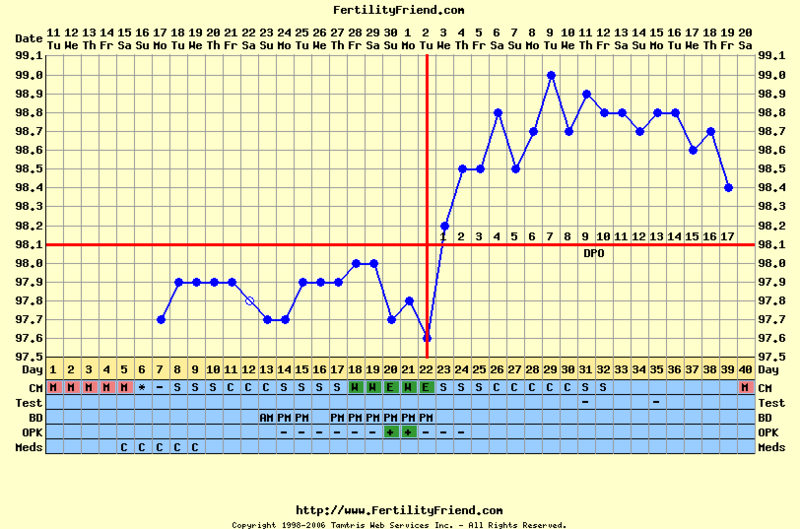
Here is my temperature chart. Sustained higher temperatures represent ovulation (marked by red dotted lines). This is the first time I have had my temps "spike" so maybe I ovulated. It is a little to early to say as they might just go down, but we will see.I also included a "normal" chart to show what it should look like during ovulation. Ovulation has a temp dip then spike along with egg white cervical mucus only 3 days before ovulation... of course pcos gives you very erratic temps and cervical mucus so it is hard to predict.. but im mostly charting so i can show the doctor how anovulatory I am.
My Chart

Normal Chart
So egg dropping, panty dropping ... who knows.. come back in a few days to find out.


Post a Comment